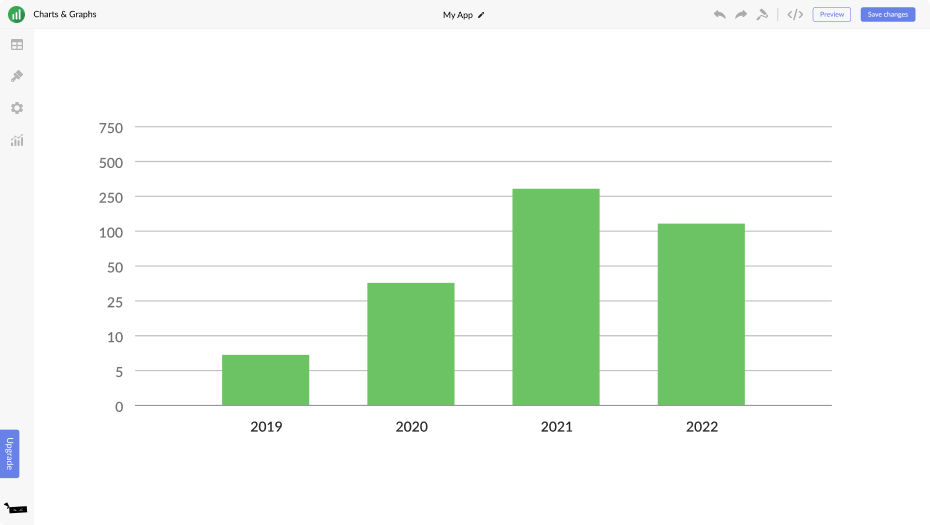
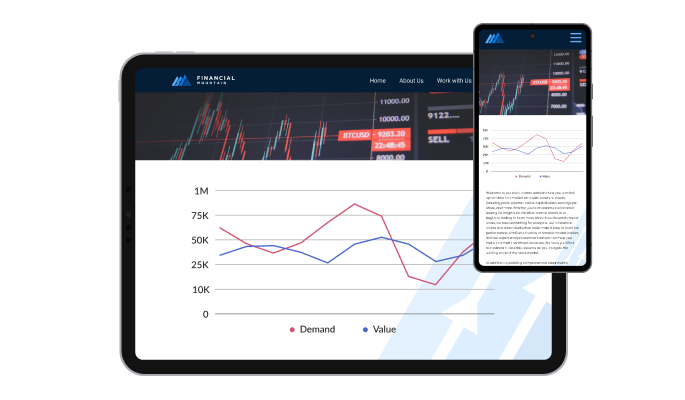
A charts and graphs widget is a pre-designed, interactive element that can be added to a website or application to display data in a visual format, such as a bar chart, line graph, pie chart, or scatter plot. Widgets are often created using JavaScript libraries or other web development tools, and they can be easily customized to display different types of data or to meet specific design requirements.
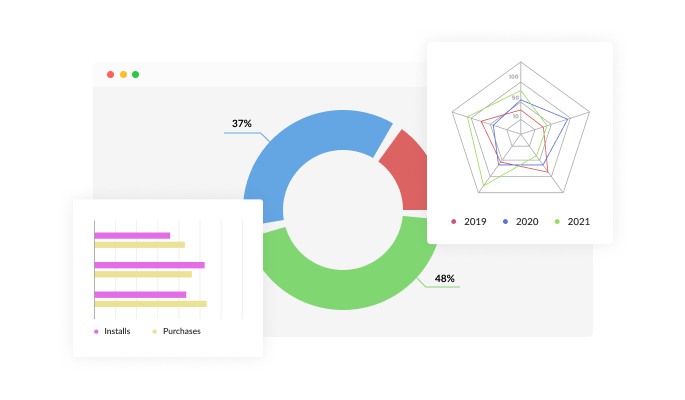
Charts and graphs widgets are often used to display data clearly and concisely, making it easier for users to understand and interpret the information. They can also be interactive, allowing users to hover over or click on different elements to display additional information or explore the data more deeply.
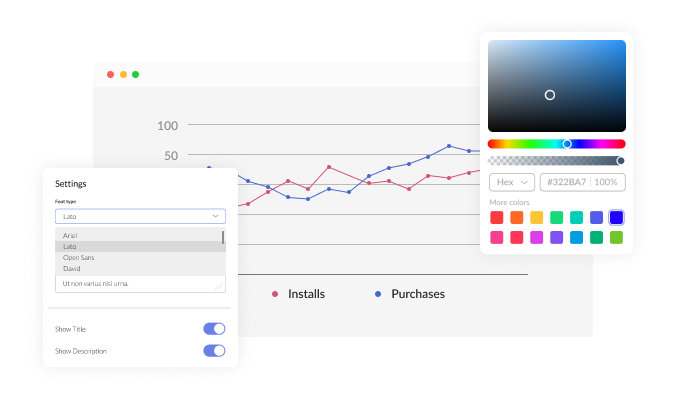
Using charts and graphs widgets can help improve the user experience on a website or application by making the data more accessible and engaging for users. They can also be helpful tool for presenting data professionally and visually appealingly, which can increase the credibility of the information being presented.