How to add Charts & Graphs to a Brightspot website

Learn how to embed Common Ninja’s Charts & Graphs on your Brightspot website without coding.

Create a Chart

loved by 500K+ businesses

widget-editor

In This Guide

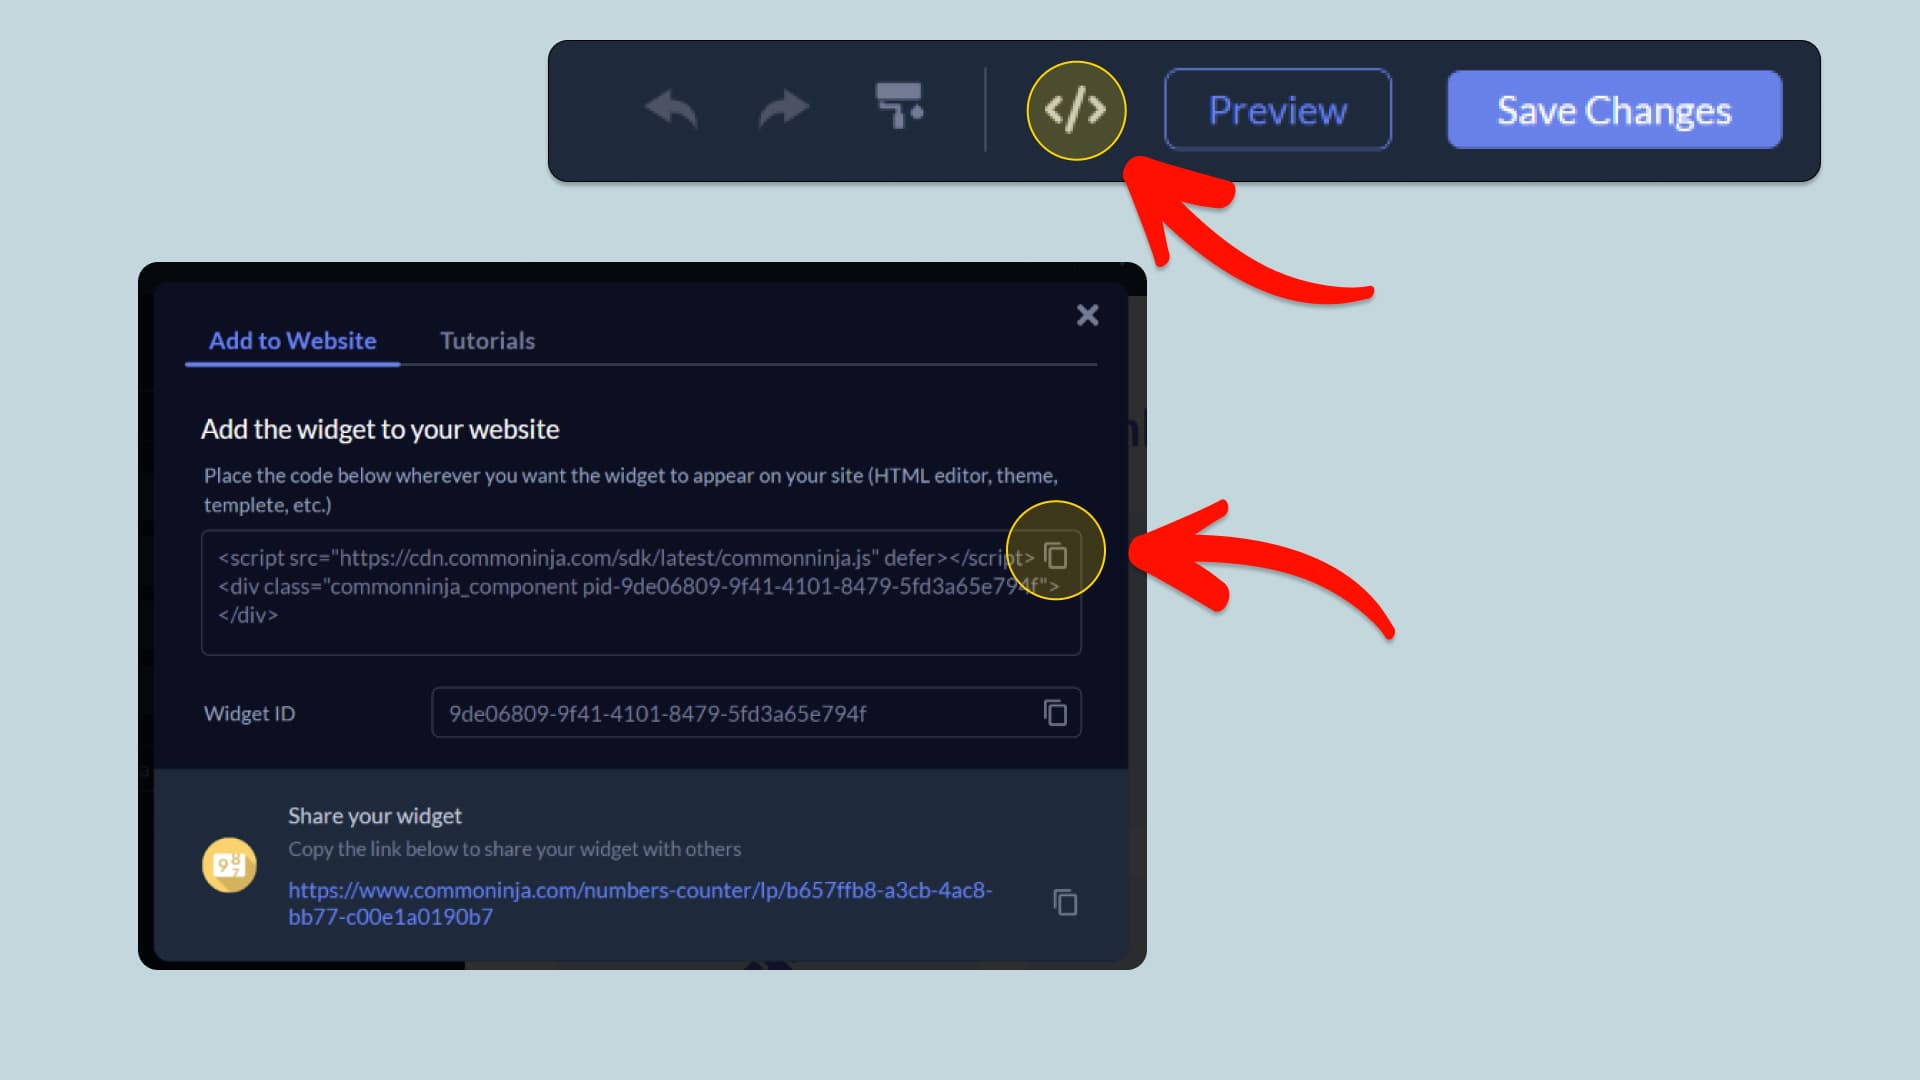
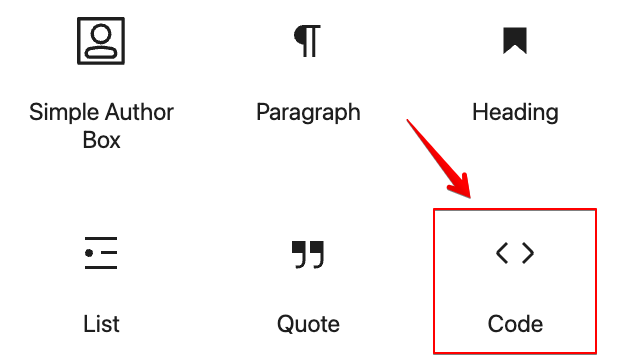
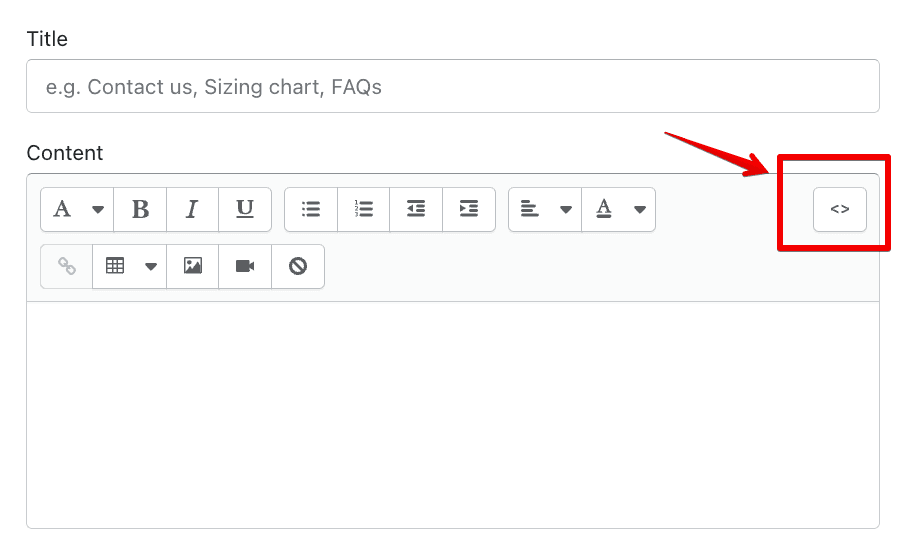
In this quick guide, you'll learn how to embed the Charts & Graphs into your Brightspot website by generating your embed code and adding it seamlessly to your website.

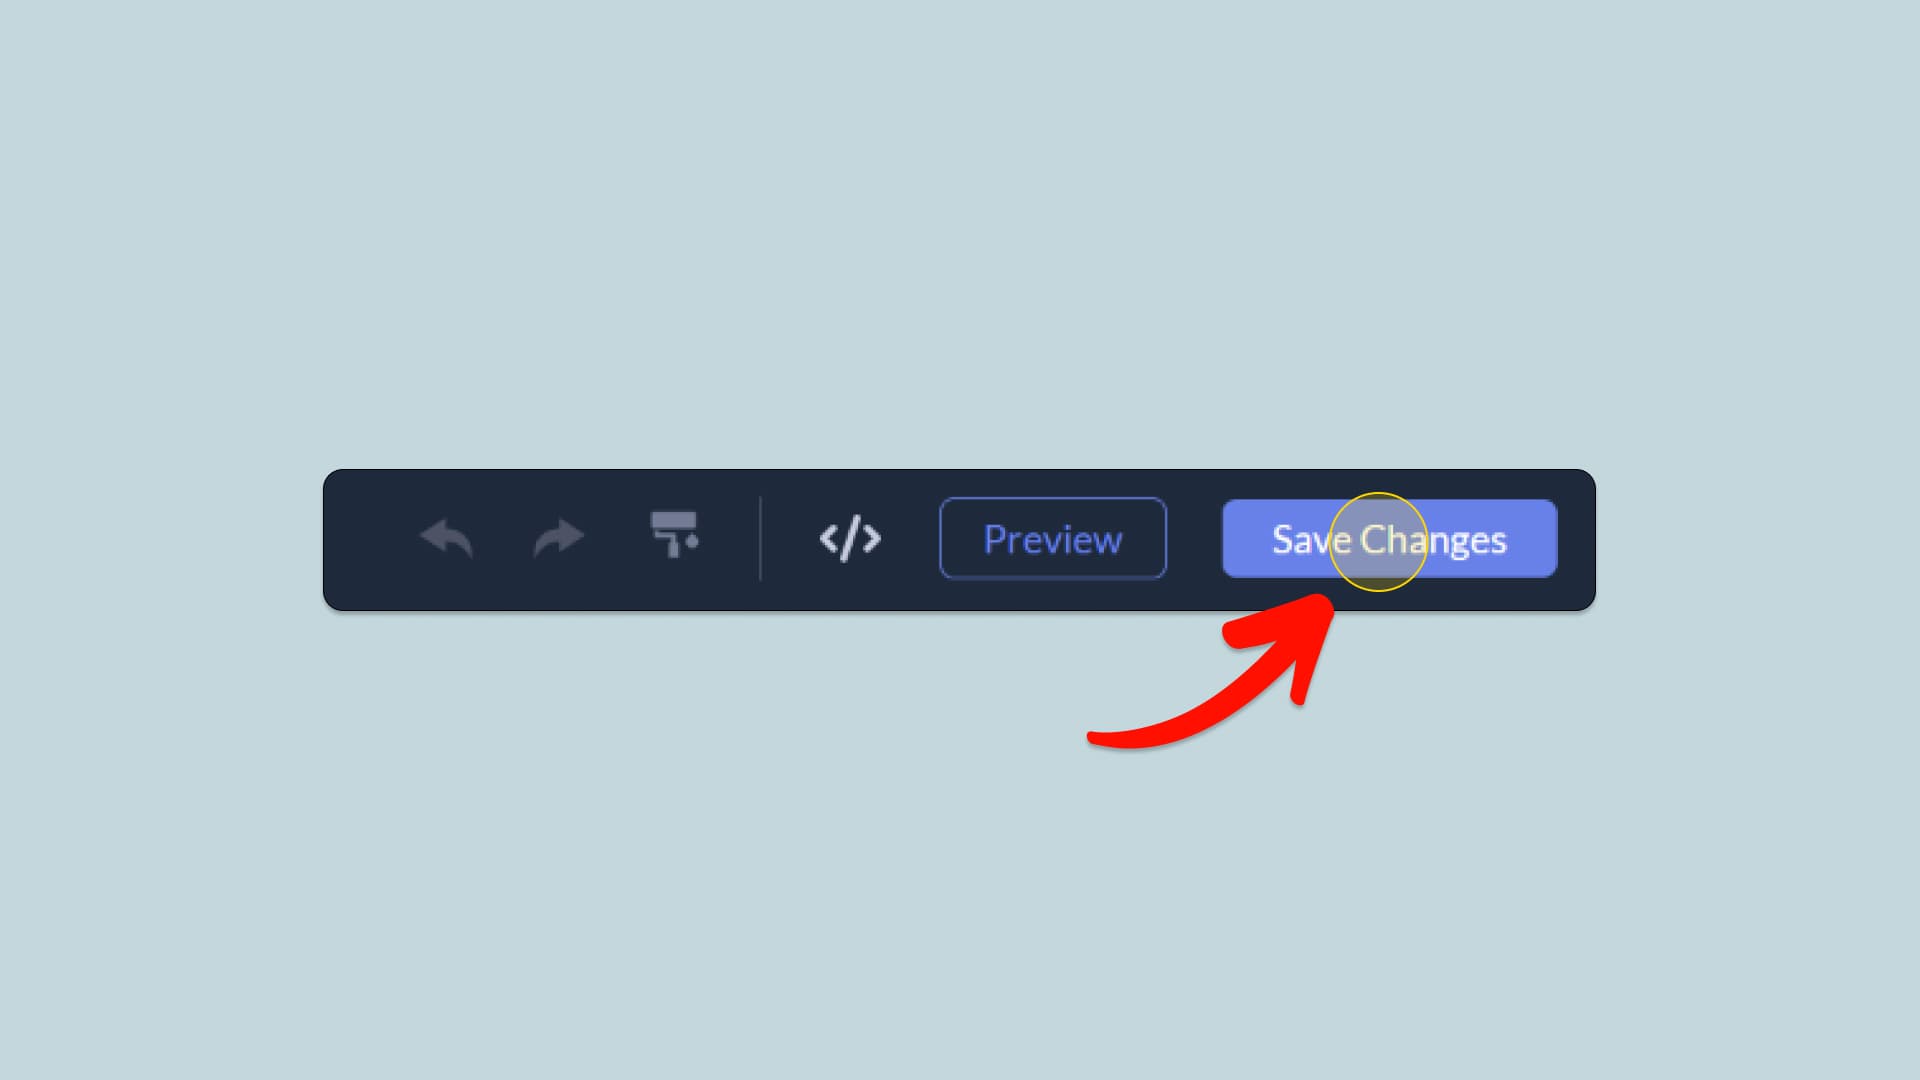
Embed Charts & Graphs on Brightspot

01
Create a Charts & Graphs integration for Brightspot on Common Ninja
First, create a Brightspot Charts & Graphs integration on Common Ninja. On the integrations catalog, find the Charts & Graphs and enter the Editor.
Create a Charts & Graphs integration for Brightspot on Common Ninja
02
Save the Charts & Graphs integration
When you're done creating the Charts & Graphs integration, click on the Save Changes button at the right top corner of the editor. If you don't have an account on Common Ninja, you'll have to register first.
Save the Charts & Graphs integration
03
Copy the Charts & Graphs Embed Code
When you're ready to add the Charts & Graphs integration to your Brightspot website, click the Add To Website button at the top bar of the Editor. On the window that opens, click the Copy Icon to copy the integration embed code. In the next steps, you will paste this code into your Brightspot website.
Copy the Charts & Graphs Embed Code
04
Paste the code to your Brightspot website’s HTML field.
Next, go to your Brightspot website editor and find the HTML field. It is most likely in the form of an HTML/Code widget or module which you can find on the Brightspot’s editor. Add it to your page, and paste the Charts & Graphs Embed Code you’ve copied before to the HTML field. Save and update, and that’s it, you should have Common Ninja’s Charts & Graphs integration on your Brightspot website.
Paste the code to your Brightspot website’s HTML field.
05
Alternative Method 1: Through the HTML option in the text’s editing area.
If you can't find the HTML/Code widget or module, there's another way to put Common Ninja’s Charts & Graphs integration on your Brightspot integration. You can just add the code to a special HTML section in the text editor.
Alternative Method 1: Through the HTML option in the text’s editing area.
06
Alternative Method 2: Add it directly to your Brightspot website’s HTML code.
If you're having trouble finding a widget or a special part in your text editor where you can add the Embed Code, you can try a different way to add the Charts & Graphs integration to your Brightspot website. You can do this by putting it straight into your Brightspot website's HTML code.
Alternative Method 2: Add it directly to your Brightspot website’s HTML code.

Why Use This Widget

Use the Charts & Graphs widget when you want to show data in a way that people can understand in seconds. Tables of numbers are hard to read, especially on mobile, and long explanations often hide the key message. With this widget, you can present trends, comparisons, and distributions using bars, lines, pies, and other visual formats that match your story. It works well for performance dashboards, research summaries, pricing breakdowns, survey results, and internal reports published on your site. Clear charts help visitors see what matters without doing mental math, which supports better decisions and a more professional impression of your brand.

This tutorial was written by the Common Ninja product team, creators of interactive, no-code widgets for Brightspot website. Common Ninja helps over 500,000 users build engaging online experiences without coding.