Charts & Graphs for October CMS

Add charts and graphs to your site to present data clearly, help visitors understand insights faster, and support more confident decision making.

Create a Chart

loved by 500K+ businesses

October CMS
plugineditor

Why Should You Use the Charts & Graphs Widget+?

Expedite and Improve Decision-Making with Graphs and Charts for October CMS

With the Charts & Graphs plugin, you can provide easy-to-understand information to your October CMS website visitors to improve and expedite their decision-making processes. Display the benefits of your product or service, explain how you offer value in a visual way, warn of the dangers of inactivity with dramatic charts and more!

Use Charts & graphs to Analyze and summarize large amounts of data

Using Charts & Graphics for October CMS you can summarize large amounts of data for easier understanding and better accessibility. Include annual output comparisons, quarterly yields, fun facts, and projected future results! Don’t bore your readers with huge amounts of text — show them charts!

Enhance Design and Improve User Experience

Charts & Graphs plugin enables the presentation of data in a visual manner that enhances the user's experience with your website and complements your platform's design. Choose any color scheme and add breakpoints between text. Create stunning 3D charts.

A Large Selection of Chart Types

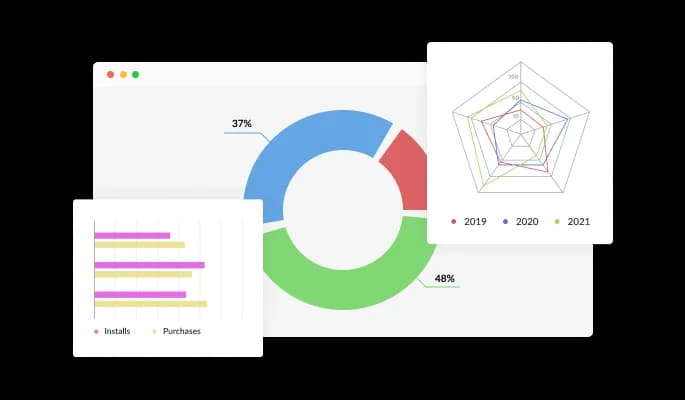
Charts & Graphs for October CMS includes 20 types of charts that allow you to present information on your October CMS website just the way you want it. From bar charts to pie charts, radial charts, and 3D charts — it’s got it all. Simply choose the chart you want and start using it, or customize it endlessly — it’s a fun game in its own right!

Charts & Graphs - A Large Selection of Chart Types

Adding data from multiple sources to your graphs and charts

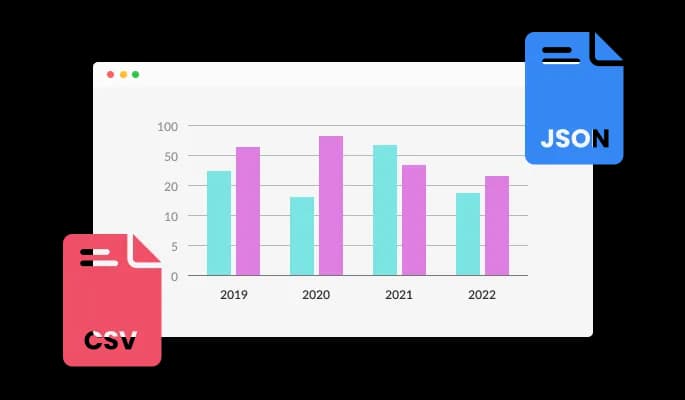
By using the Chart & Graphs app, you can create interactive charts from any CSV file or connect them with your Google Drive or other, remote URL. Upload the data wherever you feel most comfortable doing it. Display dynamic and live data on your October CMS website with the Charts & graphs plugin.

Charts & Graphs - Adding data from multiple sources to your graphs and charts

Fully Customizable Charts for October CMS

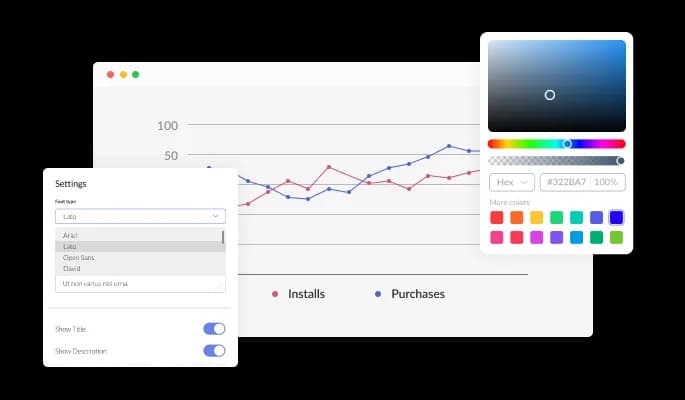
With its extensive customization features, the October CMS Charts & Graphs plugin enables you to quickly change the appearance to complement your October CMS website. To match your branding, you can alter the buttons, labels, and colors. To create a unified and polished appearance, you can select from a variety of font alternatives and modify the font's size, style, and color. You can alter the spacing in addition to these design settings to make sure that the Charts & graphs for October CMS fits perfectly into your website layout.

Charts & Graphs - Fully Customizable Charts for October CMS
Charts & Graphs - A Simple to use Graph plugin

A Simple to use Graph plugin

Charts & graphs for October CMS do not require any coding knowledge. The intuitive dashboard with drag-and-drop functionality will allow you to customize the Charts & graphs plugin in any way you'd like with just a few clicks.

Charts & Graphs - Use Tooltips

Use Tooltips

Add tooltips that offer more details about your website to your October CMS graphs and charts to improve them. These tooltips can assist your users in better grasping and analyzing the information you are displaying by elaborating on certain data points or giving context for your chart or graph.

Charts & Graphs - Graphs & Charts Color Scheme

Graphs & Charts Color Scheme

You have the option to define a color scheme that will be used as the default colors for your October CMS charts and graphs plugin when they are automatically generated from an external source of data. You can make sure that your charts and graphs look uniform and aesthetically pleasing even when they have been generated automatically by establishing a color scheme.

Fully Responsive Charts Design for your October CMS website

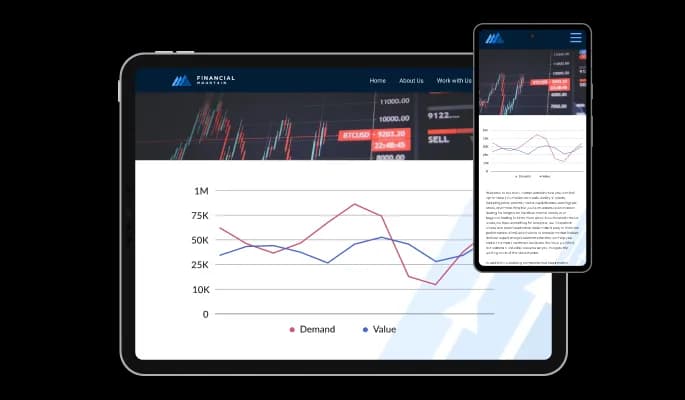
An important resource for every website is the Charts & Graphs plugin for October CMS. In addition to having a clean and contemporary design that will improve the overall appearance of your October CMS website, it is fully responsive, meaning it will adjust flawlessly to fit the screen size of any device. It is critical to have a website that is optimized for mobile viewing in a world where more and more people are accessing the internet through their phones and tablets. You can accomplish this and gain an advantage over rivals with the Charts & Graphs plugin.

Charts & Graphs - Fully Responsive Charts Design for your October CMS website

Using customized CSS with the Charts & graphs

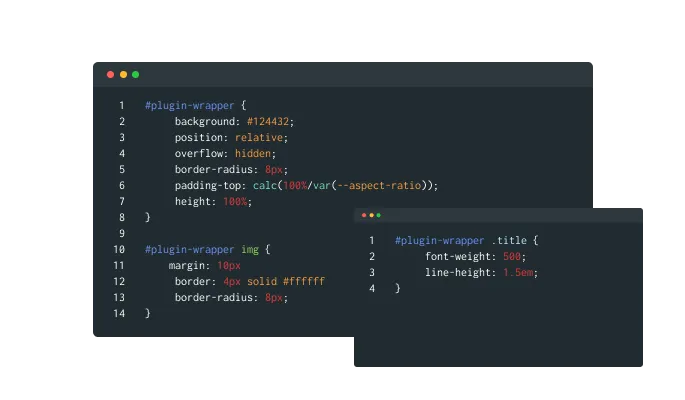
You have complete control over the October CMS Charts & Graphs plugin appearance thanks to our sophisticated advanced editor. You can quickly alter the colors, fonts, layout, and positioning of every element of the plugin's appearance with this function. Yet, if you're feeling extremely inventive, you can enhance your customization by making changes straight to the CSS. This gives you the ability to make even more advanced changes to the Charts & graphs plugin, allowing you to make it your own. Our advanced editor includes everything you need, whether you want to make a few straightforward adjustments or go all out with sophisticated changes.

Charts & Graphs - Using customized CSS with the Charts & graphs

Embedding to your October CMS website is simple

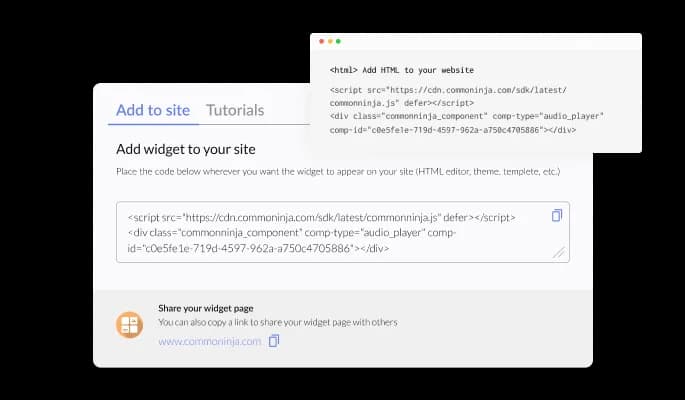
By copying and pasting one line of code, you can embed the Charts & graphs plugin on your October CMS website. Your October CMS Charts & graphs will be automatically updated on your October CMS website when you make changes.

Charts & Graphs - Embedding to your October CMS website is simple

Compatible With All Site Builders, E-Commerce Platforms and Websites

View all supported platforms

FAQ

Yes, the Charts & Graphs widget features a selection of 3d charts. 

Yes, the Charts widget features an auto-refresh option. 

Using the Charts & Graphs widget is very easy. Simply sign up and start using the free version. There's no need to worry about complicated setup or installation processes, as the Charts & Graphs widget is designed to be user-friendly and straightforward. Once you've signed up, you'll have access to all of the basic features and functions of the widget, which you can use to enhance your website and improve your online presence. From there, you can choose to upgrade to the paid version if you want to access more advanced features and capabilities. Regardless of which version you choose, you'll find that the widget is a powerful and easy-to-use tool that can help you take your online presence to the next level.

The Common Ninja Charts & Graphs widget is a free tool reach with features and options. While this widget is free to use, it does have a limit on the number of views it can handle. This means that after a certain number of views, the chat button may no longer be visible or functional on your website. It is important to note that this view limit may vary depending on the plan you are using. Despite this limitation, Common Ninja's Charts & Graphs is still a valuable tool for businesses looking to increase customer engagement and improve the overall user experience of their website.

The Common Ninja's Charts & Graphs widget is a versatile tool for any website builder. This means that you can easily add this widget to your website or store no matter what platform you use to build your website. The Charts & Graphs widget will work seamlessly with your platform whether you are using a popular website builder or something more specialized. This means you can enjoy all the benefits of this powerful tool without having to worry about compatibility issues.

It’s very easy to embed Common Ninja’s Charts & Graphs widget on your website and the process consists of two steps:


  1. Once you’ve finished working with the Charts & Graphs widget, copy the HTML text that can be found under the 'Add to Website' tab on the widget’s dashboard.
  2. On your website builder, find the 'embed' widget option, place it where you want the Charts & Graphs widget to appear, and then paste the HTML code you’ve copied before into the widget.

The Charts & Graphs widget is designed to comply with the General Data Protection Regulation (GDPR), a set of EU regulations protecting personal data and privacy. When using the Charts & Graphs widget, you can be confident that it will not collect or store personal data that could violate GDPR regulations. This ensures that your business is in compliance with these regulations and can protect your customers' data privacy. Overall, the Charts & Graphs widget is a secure and reliable tool that can be used to enhance your website without any concerns about GDPR compliance.

No need for coding skills. Our Charts & Graphs widget is designed to be easy to use, even for those with limited technical experience. The widget features a user-friendly interface that allows you to easily customize the widget without coding knowledge. You can fully customize the Charts & Graphs to match your branding. When you're done, simply copy the provided code and paste it into your website. It's that simple!

Embedding the Charts & Graphs widget on your website is a straightforward process. Simply copy the provided code and paste it into the desired location on your website. The widget will seamlessly integrate into your site, allowing you to take advantage of its features and functions. No technical expertise or programming knowledge is required - just copy and paste the code to get started. This simple process allows you to easily add the widget to your website and enhance its functionality without any hassle.

Yes. We are eager to hear your request. Please refer to this page.

Displaying charts and graphs on a website can have several benefits, including:

  1. Improved data visualization: Charts and graphs can make it easier for users to understand and interpret data by visually representing the information. This can be especially helpful when dealing with large amounts of data or complex concepts.
  2. Enhanced credibility: By presenting data in a clear and visually appealing way, you can increase the credibility of your website and the information you are presenting.
  3. Greater engagement: Charts and graphs can make your website more engaging by providing an interactive element for users to explore and interact with.
  4. Improved user experience: By providing users with an easy-to-understand visual representation of data, you can improve their overall experience on your website and make it more enjoyable for them to use.
  5. Increased traffic: By providing valuable and exciting information, you can attract more visitors to your website, which can lead to increased traffic and potentially even higher conversion rates.


A charts and graphs widget is a pre-designed, interactive element that can be added to a website or application to display data in a visual format, such as a bar chart, line graph, pie chart, or scatter plot. Widgets are often created using JavaScript libraries or other web development tools, and they can be easily customized to display different types of data or to meet specific design requirements.

Charts and graphs widgets are often used to display data clearly and concisely, making it easier for users to understand and interpret the information. They can also be interactive, allowing users to hover over or click on different elements to display additional information or explore the data more deeply.

Using charts and graphs widgets can help improve the user experience on a website or application by making the data more accessible and engaging for users. They can also be helpful tool for presenting data professionally and visually appealingly, which can increase the credibility of the information being presented.